What Is Your Data Telling You?

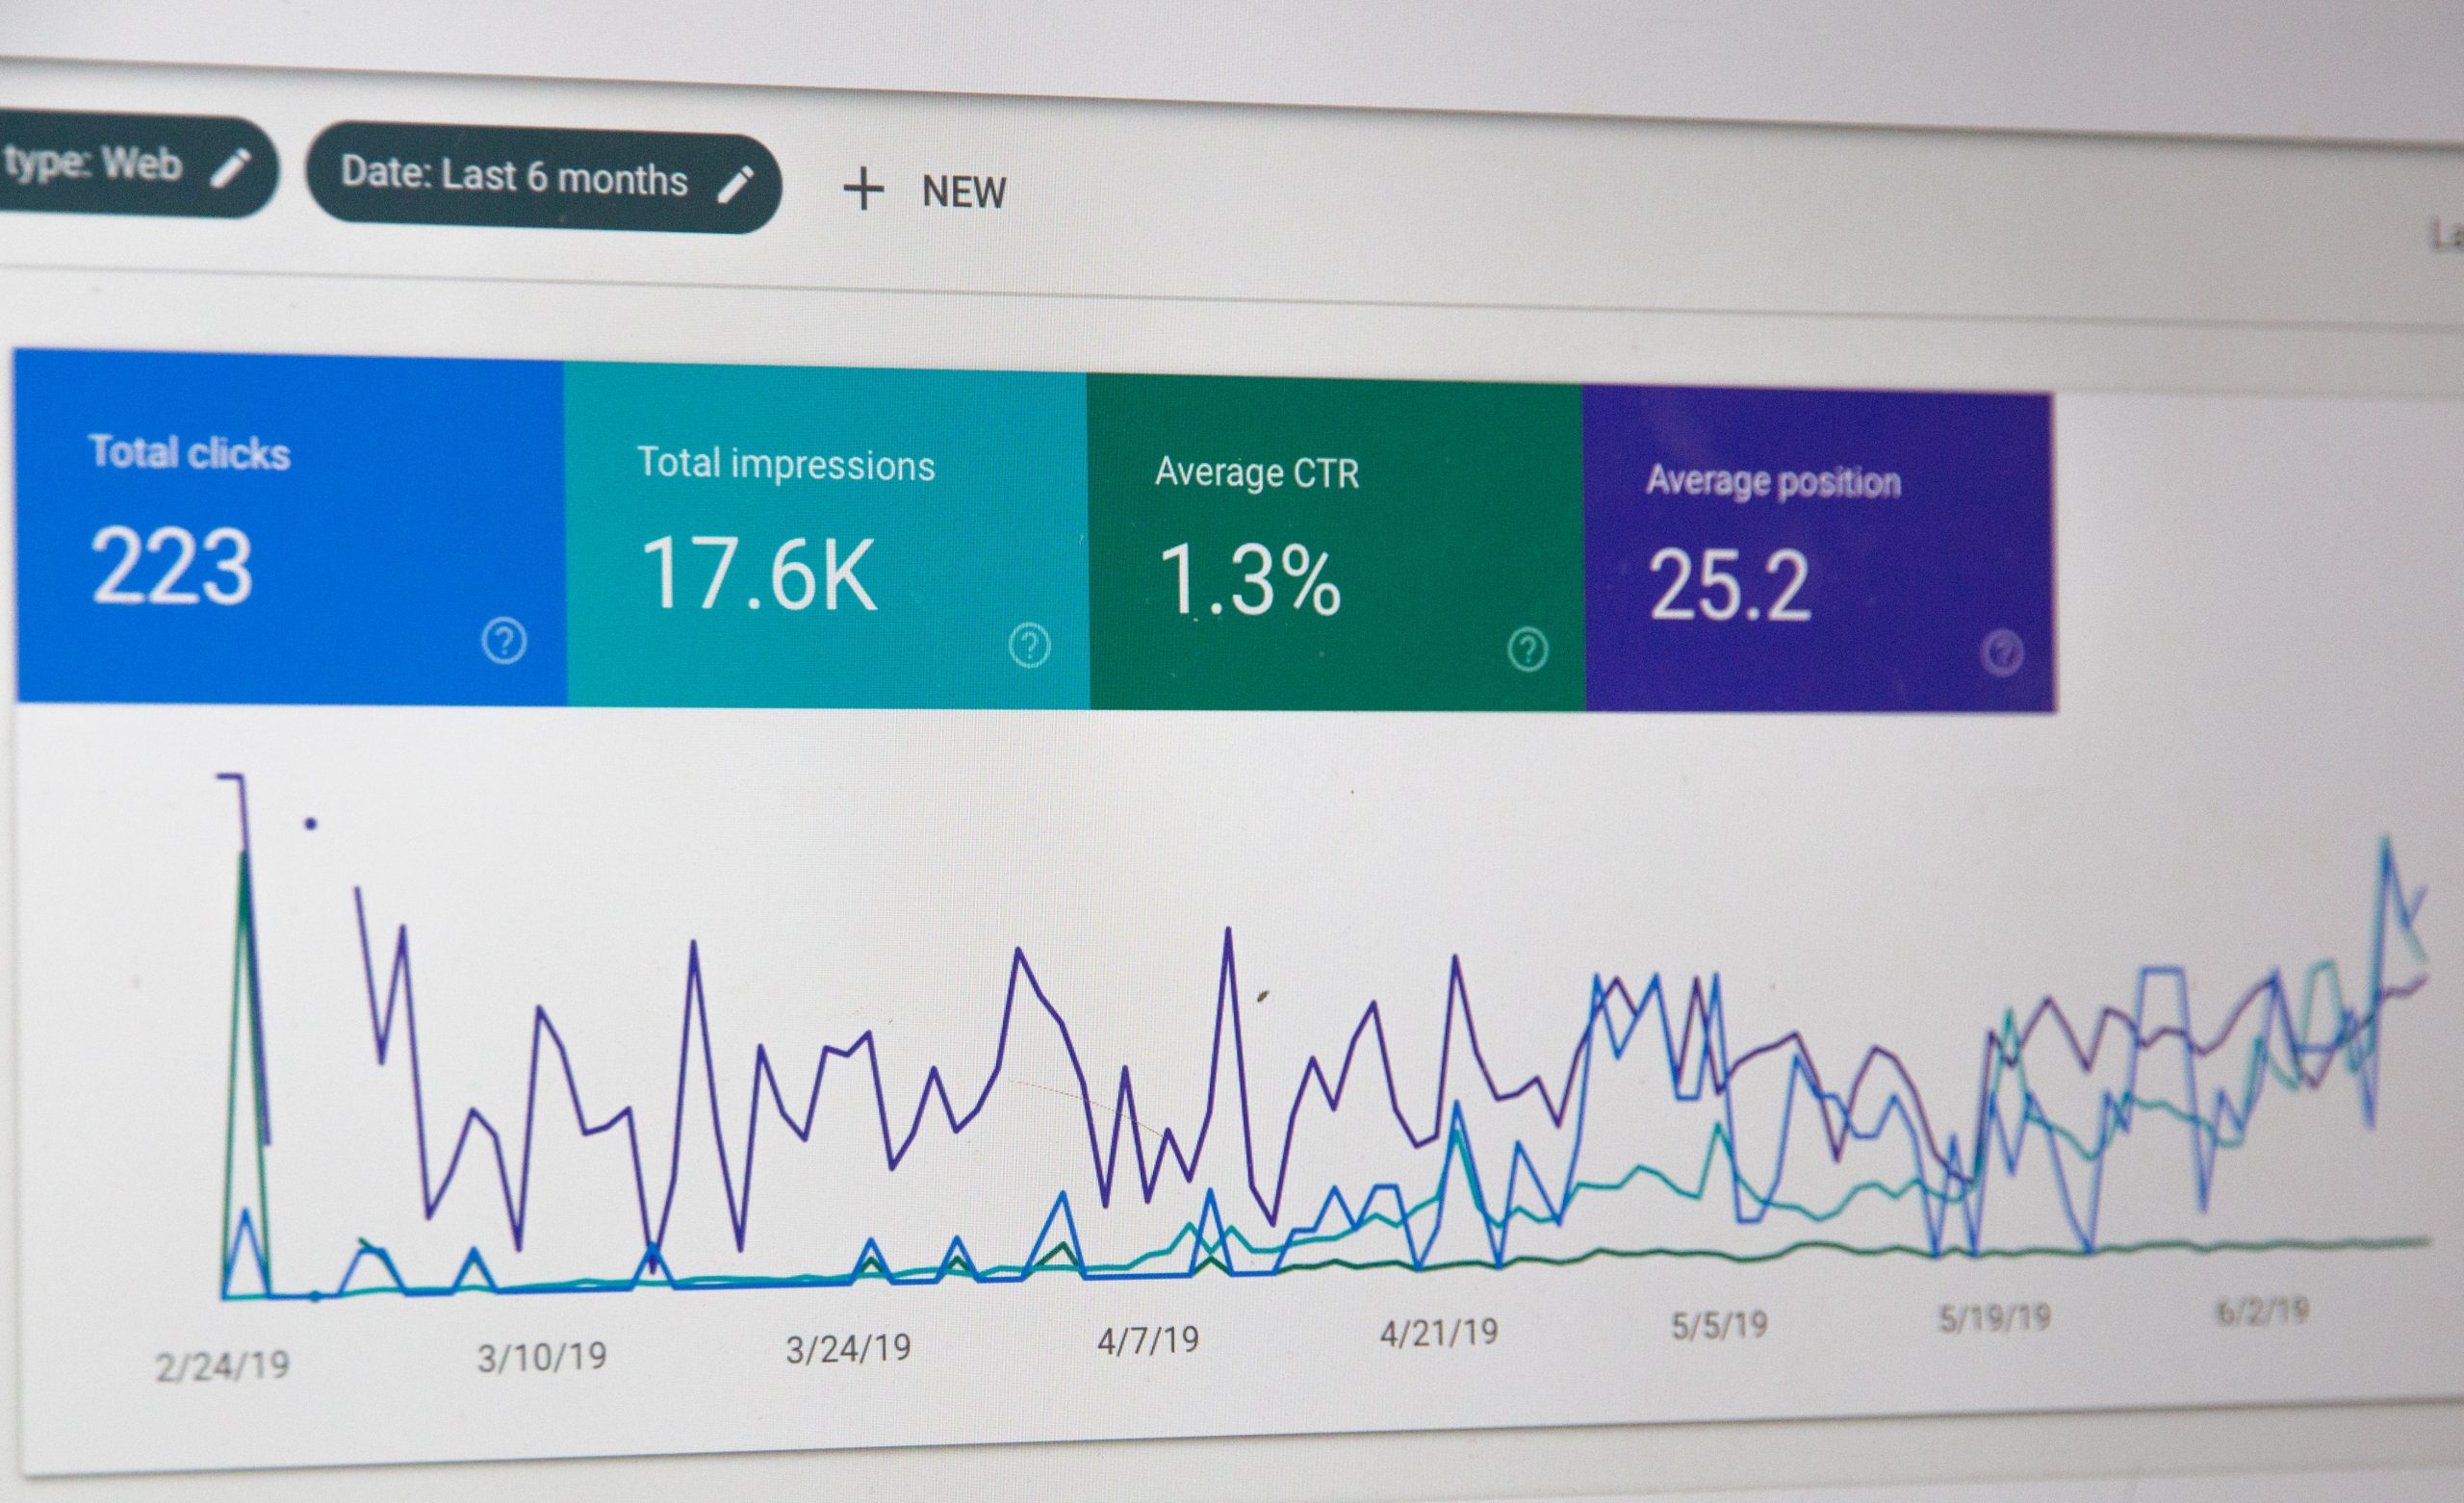
Screenshot of Google Analytics.

Ring, ring, ring ………. 

Believe it or not, that’s your Data calling. In all likelihood, the conversation is going to go one of three ways:

You hear who it is and immediately reply I’m not interested, take me off your list.

You see that it’s your Data calling and you’re excited to talk, but all you can hear are the teacher’s voices from Charlie Brown.

You have a nice long chat and receive a lot of valuable insights, but it’s just too much all at once so you’re not sure what your next steps should be.

There’s nothing wrong with any of those responses, which is why they’re so common. The alternative is that you’re actively using your Data every step of the way to measure success and influence planning. But if that’s the case, Data wouldn’t be calling in the first place.

In 2013, Hubspot social media scientist Dan Zarrella told Forbes “marketing without Data is like driving with your eyes closed.” Five years later his statement carries even more weight as the marketing canvas on which we paint has exponentially grown and matured. Luckily, marketing analytics come in all shapes and sizes with varying degrees of complexity and usefulness. And there isn’t a right or wrong way to use the Data. The only rule is that you use it.

Data Driven Marketing

Studying Data and analytics can seem overwhelming and daunting. Sometimes it can feel like a never-ending process. But I often equate it to launching and maintaining social media platforms. Yes, having as broad a presence is ideal, but not every network is going to be appropriate, nor will your comfort level be consistently high across the board. So, you pick what fits your brand’s identity (using Data to inform this also helps!) and what won’t become a pain point and burdensome task for you. Falling into either of those two scenarios reverses the exercise’s effectiveness. And that’s the beauty of Data-driven marketing. You can make it work for you and your business.

Regardless of your background or level of experience with Data analysis, the foundation of every campaign should be molded using the answers to these three questions:

Who is the audience I’m trying to reach?

What are my most important marketing channels?

What are my objectives?

Taking it from the top, let’s use the example of a small advertising campaign. You’re given a product to market and a budget, but nothing else. Now start answering the questions.

Audience

It would be easy to run a Facebook advertising campaign where the target audience was everyone. But you could also just toss your money in the river. Instead, take some time and compile three identifying characteristics of you target individual. They can be demographic, geographic, or interest based. Now confirm those assumptions using the insights you have on hand, something like Google or Facebook analytics. (As an aside, Data doesn’t always have to be something generated from a machine and printed on a piece of paper. Anecdotal information, when gathered in enough volume, can be as effective a Data source as an algorithm).

Data Driven Marketing

Marketing Platforms

Now that you have identified the type of person you are looking to reach the next step is to figure out where. The term “marketing platforms” can mean a lot of different things based on your campaign directive. In this case it’s answering the question of where does the consumer that fits the above criteria spend most of their time. If it’s social media is it Facebook, Twitter, Instagram or Pinterest? If it’s email based what sorts of newsletters would they subscribe to, so you can buy into ad networks. Or are they strictly web browsing users? There are a host of resources to confirm your assumptions. For example, take a deep dive into your website’s inbound analytics. If a large percentage of users are finding you through Facebook (paid or organic), it’s probably a good idea to take your resources there. But if Google seems to be a popular starting spot, a targeted AdWords campaign might be the most effective. Regardless, you’re using the past to predict the future, so you can act in the present.

Objectives

We know the type of person we’re trying to reach and the platform we’d like to execute on, but how are we going to know if we were successful? It’s vital to be as specific as possible without limiting yourself so much that the findings from the analysis aren’t going to be useful down the road. The importance of this step goes well beyond the campaign at hand because it’s giving you Data to inform your next campaign. Each time you execute on something you’re compiling more and more Data, which just makes this entire process easier. You’re not saying the objective is to have a click to the website and then move on, but it’s also not that you want someone to purchase a product at high noon with a Visa Debit card. If your objective is to grow your newsletter list via advertising, set a percentage increase goal. Or if it’s sales, highlight a revenue number to meet.

Planning is done! Now go execute, study the Data after the fact, and repeat, at which point you will have officially closed the loop on a Data-driven marketing campaign. It’s not always perfect because not all Data is perfect, and sometimes doesn’t exist at all. The results might not be perfect (or even pretty) and that’s ok as well. It’s a process and it takes practice, time, and patience to improve and realize your goals.

As long as you’re not driving with your eyes closed you’ll reach your destination.

Email Marketing Metric Most Missed and Why It Matters

Gmail window displayed on laptop.

The beauty of digital marketing is that it affords immediacy, a form of instant gratification. Gone are the days of sending a magazine ad to print or waiting for the scaffolding to slowly climb up to the empty billboard you purchased for the next month. Now it’s digital display ads, segmented email marketing, geotargeted messaging, streaming video, and all the other fancy tools as marketers we use all the time.

Instead of waiting around for something to happen and then wondering if it did anything at all, digital marketing is instant execution and instant results. But in a point and click world it’s important to remember there is action needed after the click. We recently talked about the necessity of data analysis, even at its most basic level. We discussed the three questions you need to be asking before you execute as a way to inform your analytics review:

Who is the audience I’m trying to reach?

What are my most important marketing channels?

What are my objectives?

Once you’ve accomplished this step it’s time to dive in. If you’ve made it this far into the marketing process, you probably know the key metrics to look at: clicks, engagement, bounce rate, opens, time on your platform, etc. But in almost every medium there is that one key metric that is so often ignored, often to the detriment of the marketing campaign. Over the next few weeks we’ll be identifying what the metric most missed is on each platform. Today we’ll tackle email.

The Ones That Got Away

Spam: An Email Marketing Red Flag

It’s hard to not obsess over the size of your list and how many people open it. And once you start following the breadcrumbs, especially if your conversion metric is sales based, you could be spending a lot of time looking at a lot of data. And while that’s a necessity (and the point of this series of articles!) the metric most often missed is disengagement rate.

To calculate your email marketing disengagement rate, add up the total unsubscribes and spam complaints from a single campaign and divide by the number of unique opens. It’s one thing to not interact with an email, or even just not open it. Those are still newsletter subscribers that can be activated. But someone taking the effort to unsubscribe clearly is not connecting with your messaging and you’ve lost them as a lead. Even worse, offending or annoying someone to such a degree that they complain to the world wide web is a sign something just isn’t right.

Obviously you’re going to lose email subscribes, that’s just the name of the game. For example, say you gathered a chunk of addresses from a sweepstakes. That’s going to drive up your unsubscribe rate over the next newsletter or two. And that’s ok, because the net is going to be positive. In other cases, someone might just be getting too much email. That’s ok too. It’s why so many smart marketers segment out or even manually unsubscribe people who aren’t opening their emails. A good cleanse of an email marketing list never did anyone any harm. And your open rate will thank you.

But if you disengagement rate is consistently hovering at 0.2% or above it’s incredibly likely you’re just not connecting with your audience. And if a high percentage of your disengagement rate is spam complaints, you might be on the road to losing them altogether.

Don’t Leave Yet, Just Give My Email Marketing One More Chance

So, you’re losing subscribers at a pace you’re not comfortable with and it’s in your head. Maybe you’re even questioning your skills. Rather than sulk, let’s get this turned around. (Remember, there is NO crying in marketing). As you can imagine, a surefire way to get to the bottom of the problem is through testing. It’s forgotten sometimes that studying your email marketing analytics isn’t just about finding what works; it’s about finding out what doesn’t.

Here are three areas to consider:

Frequency


Think like an email receiver, and not an email sender. At what point do you say enough is enough? This could very well be the issue. Take a look at your emails over the course of a set period of time, say a month. Is your disengagement rate higher at the end of the month than the beginning? If so, at what point during the month is the increase in disengagement no longer linear? Identifying the point where it’s just too many emails can pinpoint the frequency your audience wants to hear from you. So if you’re sending out six emails a month and after the third the disengagement rate starts to increase exponentially, try testing only three emails a month. Sometimes people’s inboxes just get too full.

Unsubscribe

Content

Sure, it seems simplistic to just say, maybe your content is the problem. But it’s about more than just what’s in the email, it’s about how it’s presented and what other content it’s paired with. Every good email marketer knows that sales email after sales email after sales email is just not going to get the job done. Even if your company isn’t in the business of creating original content, there have to be times when your soft side comes out.

Test an email, even on a segment of your list, that starts with content or imagery related to your brand but with no call to action to buy. Make the call to action something completely different. Be conversational. Add the sales stuff in below the fold. A consumer is less likely to unsubscribe or complain if they’ve gotten something useful from the email before getting to the stuff that might turn them off. If you have the guts (and content) try sending an email every now and then doesn’t have the words “buy” or “order” in it.

Subject Line

A good A/B test can help you pinpoint the type of subject line that increases your open rate. But what kind of subject line increases your disengagement rate? The most likely is one that overpromises an email that under delivers. Or doesn’t deliver on the promise at all. This is going to be a huger driver of spam complaints. Crafting a good subject line is absolutely necessary, but don’t take it too far or get too cute with it. Sometimes simple is best, just done right.

Looking at these three areas and applying the findings to your email marketing initiatives will not only increase the positives and decrease the negatives, it might just help you sleep better. Remember, as long as you engage with your disengagers, you’re going to be ok.

How To: Measure Anything

Ruler, compass and other measurement tools displayed on a desk.

Removing Uncertainty:

Do you understand multivariate testing, regression analysis and statistical significance? Career potential in data science is just about as bright as you can get. For big business, big data wets the pallet of opportunity for data based solutions and line-graph insights. Target, for example, once made a young woman’s father pretty angry after sending her coupons for maternity clothing and diapers. “She’s not even pregnant” he insisted. Well, turns out she most certainly was, and Target knew before he did. See, she’d already been shopping for some pregnancy predictive items and that flagged the Target marketing machine.

Consumers are predictable. They go about their spending lives mostly staying loyal to a thin slice of brands. There are few times in someone’s life when the comfort of brand-loyalty is upheaved. Pregnancy is one of those times. It’s a valuable time for marketers to get in front of expecting mothers because she’s a free agent! The man later apologized to Target, but not after illuminating the power of data science.

What about the small and medium sized business that don’t have a team of analysts? Where does a small team pick up the tools to start hammering away at Excel sheets and statistical packages? The answer: they don’t … yet.

Work Smarter:

Business at any level is about removing layers of uncertainty. In the book, How to Measure Anything: Finding the Value of Intangibles in Business, the author talks a lot about removing uncertainty not through standard deviations, variances or T-values, but by simple measurements and observations.

Have you had meetings where a team member suggested multivariate testing a website before the team knew how much traffic the website received? When it comes to the college search, work on personalizing your website based on location before worrying about meta-tags. The common cliche’s about starting simple all apply here. Has your team dismissed something as impossible to measure or that something abstract like customer service can’t be quantified? 

To get your team thinking, here’s a great example from the book How to Measure Anything.

How would you measure all the fish in a lake?

To some teams, the question would be impossible. Or, the response would be: in order to do that, we need a budget of $1.4 million dollars to drain the lake, file permits through the EPA, hire scientists and do this over the course of the next three years. 

Here’s one solution:

You head out in a boat with some fishing gear (and hopefully some friends that know their way around a fishing pole) and catch 1,000 fish. For each fish you catch, you tag them with a tracking ID. You wait a day, go back out and catch 1,000 more fish (again..recruit some local fishing legends for this experiment). How many of the second 1,000 fish were tagged from your previous 1,000. Ten? Twenty? One Hundred? If the answer is 100, you can estimate that 1,000 is roughly 10% of the total fish population, putting the total fish population at around 10,000 fish. Now, is the number perfect? No. But did you save a lot of time money and energy? Yes.

For businesses without someone that knows their way around SPSS or other statistics packages, thinking outside the box when it comes to measuring business questions is hugely important. Because for every company that says, “we can’t possibly measure that”, there’s a company out there bringing in fish. Slowly removing layer upon layer of uncertainty.